Logo

Experience a tailored walkthrough of our solution and find out how it fits your workflow perfectly.

Contact Us

Get early access

Stay updated with our latest news and offers.

Follow Us

Oncology EHR with chemotherapy tracking, treatment protocol documentation, and AI clinical intelligence

Oncology EHR with chemotherapy tracking, treatment protocol documentation, and AI clinical intelligence

Digital Patient Chart supports oncology practices with chemotherapy cycle documentation, treatment protocol tracking, and infusion scheduling inside one system. Each treatment protocol tracks cycles administered versus prescribed, dose modifications, lab values per cycle, and adverse events. The AI reviews treatment response data and lab trends during pre-visit analysis. Infusion chairs, provider time, and lab stations schedule together so patients move through blood draws, consultations, and infusion without gaps or double-booked resources.

  • Chemotherapy cycle tracking and dose documentation

    Each treatment protocol logs cycles completed, drugs administered, doses (planned versus actual), dose modifications with clinical rationale, and cumulative toxicity. The provider sees the full treatment arc from cycle one through completion.

  • Infusion chair and resource scheduling

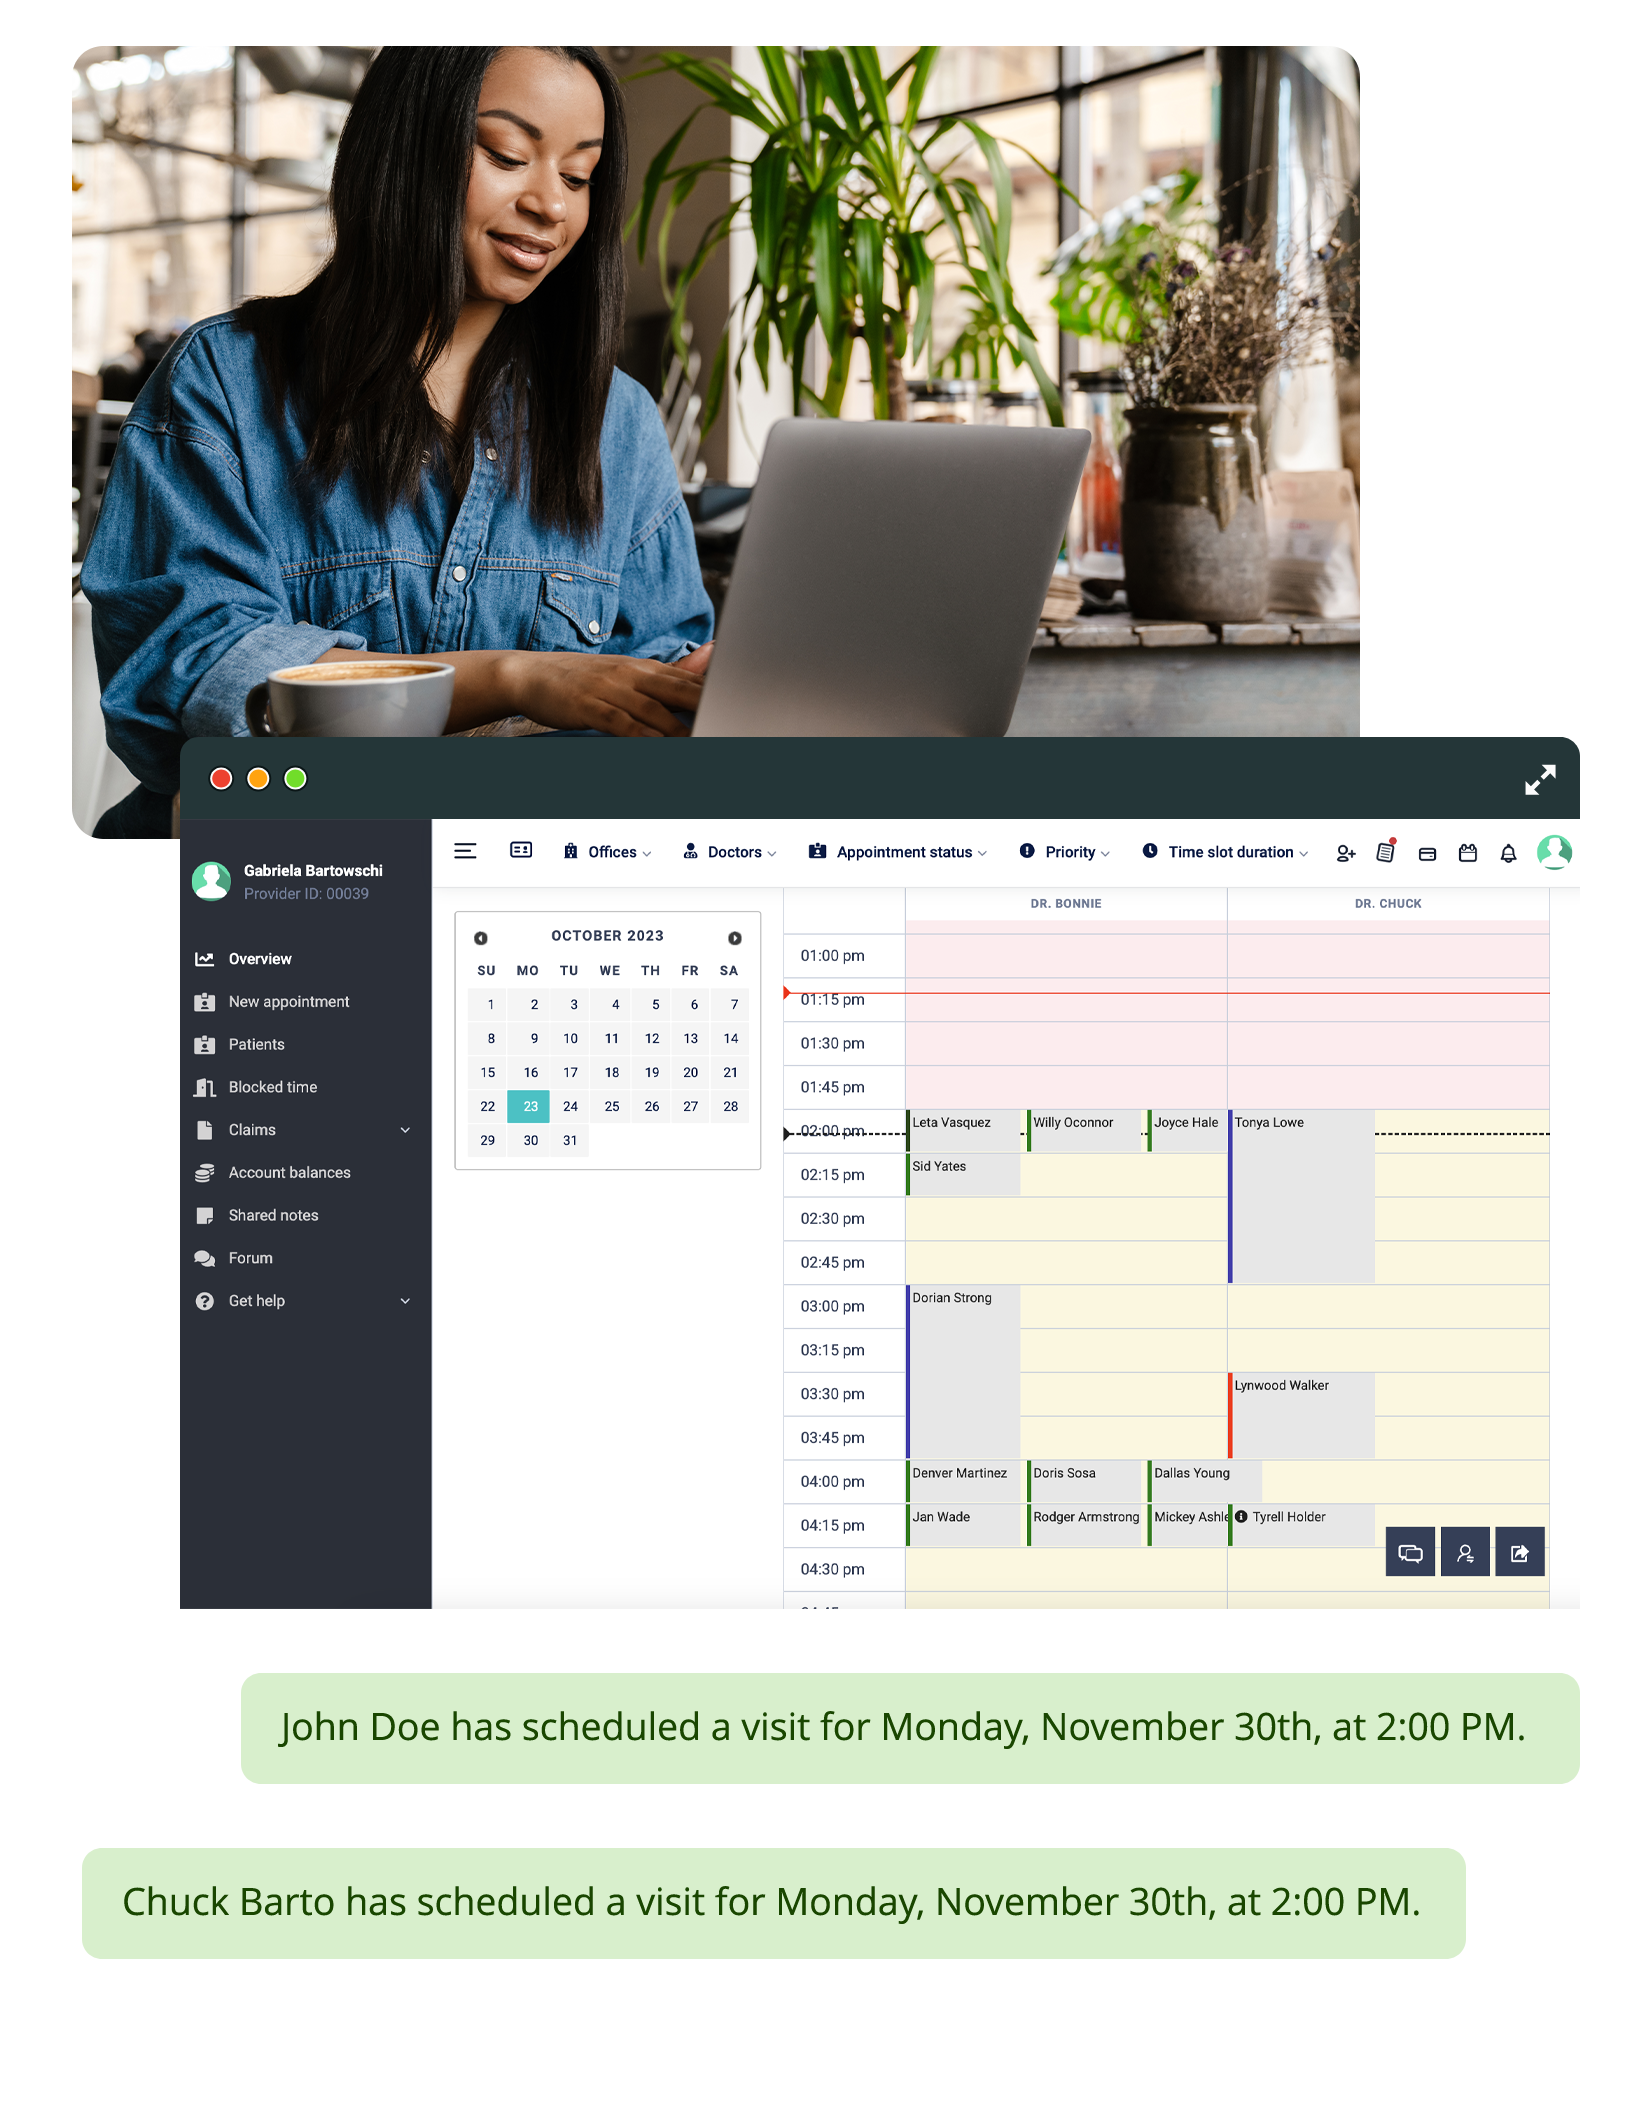
    The scheduling engine manages infusion chairs, provider time, lab draw stations, and pharmacy prep as separate resources. An infusion appointment reserves the chair for the full duration, not a standard time slot. Concurrent infusions schedule into separate chairs automatically.

  • Lab trend monitoring per treatment cycle

    CBC, metabolic panels, tumor markers, and organ function labs track per cycle. The provider sees how blood counts recover between cycles, whether tumor markers are trending, and where dose-limiting toxicities are developing.

  • AI pre-visit analysis with treatment context

    Before the patient arrives, the AI reviews the current cycle number, lab trends, dose modifications, adverse events from prior cycles, and imaging response data. The provider walks in knowing the treatment trajectory.

What the platform does for oncology practices

Specialty-specific SOAP templates for oncology

The form builder creates fields for treatment protocol documentation, cycle-specific assessments, toxicity grading (CTCAE), performance status scoring (ECOG/Karnofsky), and disease staging. The AI maps voice transcription to these fields during the encounter so the provider dictates naturally through a complex oncology visit.

Chemotherapy protocol tracking

Each treatment regimen tracks as a protocol with defined cycles, drugs, and dosing. The system logs planned dose versus administered dose per cycle, dose modifications with clinical rationale, treatment delays, and cycle completion status. The provider sees the full protocol timeline in one view.

Lab monitoring per treatment cycle

CBC with differential, comprehensive metabolic panel, tumor markers, and organ-specific labs track per cycle. Nadir counts, recovery trends, and cumulative lab changes display alongside the treatment timeline. Values crossing dose-modification thresholds surface during pre-visit analysis so the provider addresses them before ordering the next cycle.

Infusion scheduling with chair and resource management

Chemotherapy infusions vary from 30 minutes to 8+ hours. The scheduling engine blocks the infusion chair for the actual treatment duration. Pre-infusion lab draws schedule into phlebotomy stations with enough lead time for results. Provider consultation slots align with the infusion schedule so the patient sees the oncologist before treatment starts.

Imaging response tracking

CT, PET, and MRI imaging for treatment response assessment displays through the built-in DICOM viewer. Images attach to the treatment timeline. The provider tracks radiographic response (RECIST criteria, metabolic response) alongside the treatment protocol to assess whether the regimen is working.

Pre-visit analysis for oncology patients

Before the patient arrives, the AI reviews the current protocol status, cycle number, lab trends since the last cycle, dose modifications, reported adverse events, and imaging response data. The provider starts the visit knowing where the patient stands in treatment and what clinical decisions are pending.

Oncology-specific billing

CPT codes for chemotherapy administration (by time and complexity), hydration, antiemetic infusions, port access, E/M consultations, and drug codes (J-codes) populate from documented services. Each infusion logs start and stop times for accurate time-based billing. The invoice generates at checkout.

Structured Onboarding for Oncology Practices

Oncology practices managing active treatment protocols need patient chemotherapy histories, cycle data, and lab monitoring records migrated with full continuity. Our onboarding team configures treatment protocol templates, infusion chair scheduling, cycle-specific lab tracking, and DICOM integration for response imaging. Providers train on AI voice documentation for oncology encounters so the practice maintains treatment continuity from the first day on the new system.

Read More
Structured Onboarding for Oncology Practices

Frequently Asked Questions

Shape

Which EHR tracks chemotherapy protocols with per-cycle dose documentation?

Digital Patient Chart logs each treatment protocol with cycles completed, drugs administered, planned versus actual doses, dose modifications with rationale, and cumulative toxicity. The provider sees the full protocol timeline from cycle one through completion in one view.

Can the scheduling engine handle multi-hour infusion appointments?

The scheduling engine blocks infusion chairs for the actual treatment duration, not a standard appointment slot. Pre-infusion labs schedule into phlebotomy stations with lead time for results. Provider consultations align with the infusion schedule. Concurrent infusions book into separate chairs automatically.

Does the system track lab values per chemotherapy cycle?

CBC, metabolic panels, tumor markers, and organ function labs track per cycle inside the patient record. Nadir counts, recovery trends, and cumulative changes display alongside the treatment timeline. Values crossing dose-modification thresholds surface during pre-visit analysis.

Can the EHR display treatment response imaging?

CT, PET, and MRI imaging displays through the built-in DICOM viewer and attaches to the treatment timeline. Providers track radiographic response alongside the treatment protocol to assess regimen effectiveness.

Does the AI review oncology treatment data before appointments?

Before the patient arrives, the AI reviews protocol status, cycle number, lab trends, dose modifications, adverse events, and imaging response data. The provider starts the visit with the full treatment trajectory and pending clinical decisions.

How does billing work for chemotherapy administration?

CPT codes for chemotherapy administration by time and complexity, hydration, antiemetics, port access, E/M consultations, and J-codes for drugs populate from documented services. Infusion start and stop times log for time-based billing accuracy. The invoice generates at checkout.

See chemotherapy tracking, infusion scheduling, and AI clinical intelligence in a live demo

See chemotherapy tracking, infusion scheduling, and AI clinical intelligence in a live demo

Get a Demo

We use first-party cookies to run this site and understand how patients find us. Privacy